

Tutorial Videos
Get the most out of Servier Medical Art‘s free medical illustrations with our tutorial videos! Learn how to use the image bank in PowerPoint® and create visually stunning presentations that captivate your audience.
Introduction
 This video will introduce you to SMART by Servier, which empowers you to create and animate professional-level PowerPoint presentations in minutes.
A million users
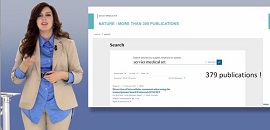 SMART by Servier launched 12 years ago and already has over one million users worldwide. At nature.com, you can find hundreds of publications illustrated with SMART. This video will introduce you to illustration examples from the medical literature.
Build your illustrations
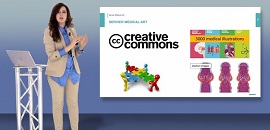 This video demonstrates how you can add images and elements, such as cellular components, to your presentation. All of which are fully customizable vector images licensed under Creative Commons, so no permissions are needed for use.
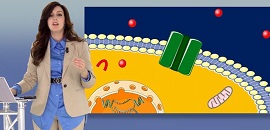
Cell surface receptors
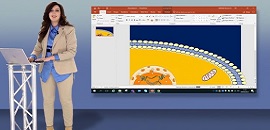 In this video, we show you how to add intracellular components to your presentation. You’ll find all that you need. For example, from the “Intracellular Component” folder, you can choose from many elements such as the golgi appratus, endoplasmic reticulum, mitochondria, etc, and paste the vector images into your presentation, modifying them to fit the space you need without affecting the quality of the image.
Adding motion
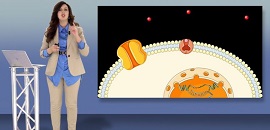
 This tutorial shows you how to add movement to elements within your presentation. For example, this video specifically demonstrates how to add controlled movement to molecules in a slide to illustrate drug inhibition, in this particular case, a drug preventing a molecule from entering a cell. You will see how to specify a “Custom Path” for movement of elements and modify speed and more from the animation tab.
Heart failure
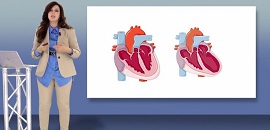 This video demonstrates another way you can use motion to give life to your presentation. Here, we use the example of demonstrating heart failure by comparing illustrations of the heart in its normal and pathological states, using animation to make the slide more dynamic.
Patient education
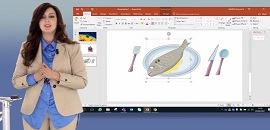 SMART is also useful for patient education. For example, if you’d like to talk with your patients about the importance of healthy eating, this video shows how you can build slides using elements from the “Risk Factors” folder and specifically the “Dietetics” presentation.
Epidemiological data
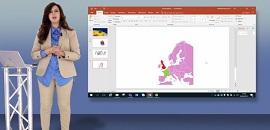 Adding epidemiological data and world maps into your presentations doesn’t need to be difficult. We’ve made it easy. This video talks about our “World Map” folder, which gives you access to illustrations of countries and continents that you can customize by highlighting what you’d like to emphasize.